
| Season | Lg | W | L | W/L% | SRS | Pace | ORtg | Rel ORtg | DRtg | Rel DRtg | Playoffs | Top Win Shares |
|---|---|---|---|---|---|---|---|---|---|---|---|---|
| 2025-26 | NBA | 29 | 42 | .408 | -5.55 | 97.7 | 112.9 | -2.6 | 118.7 | 3.2 | — | G. Antetokounmpo (5.1) |
| 2024-25 | NBA | 48 | 34 | .585 | 2.12 | 99.3 | 115.9 | 1.4 | 113.4 | -1.1 | Lost 1st Rnd | G. Antetokounmpo (11.5) |
| 2023-24 | NBA | 49 | 33 | .598 | 2.44 | 99.9 | 118.4 | 3.1 | 115.8 | 0.5 | Lost 1st Rnd | G. Antetokounmpo (13.2) |
| 2022-23 | NBA | 58 | 24 | .707 | 3.61 | 100.5 | 115.4 | 0.6 | 111.9 | -2.9 | Lost 1st Rnd | G. Antetokounmpo (8.6) |
| 2021-22 | NBA | 51 | 31 | .622 | 3.22 | 99.9 | 115.1 | 3.1 | 111.8 | -0.2 | Lost Semis | G. Antetokounmpo (12.9) |
| 2020-21 | NBA | 46 | 26 | .639 | 5.57 | 102.2 | 117.2 | 4.9 | 111.4 | -0.9 | WON FINALS | G. Antetokounmpo (10.2) |
| 2019-20 | NBA | 56 | 17 | .767 | 9.41 | 105.1 | 112.4 | 1.8 | 102.9 | -7.7 | Lost Semis | G. Antetokounmpo (11.1) |
| 2018-19 | NBA | 60 | 22 | .732 | 8.04 | 103.3 | 113.8 | 3.4 | 105.2 | -5.2 | Lost Finals | G. Antetokounmpo (14.4) |
| 2017-18 | NBA | 44 | 38 | .537 | -0.45 | 96.3 | 109.8 | 1.2 | 110.1 | 1.5 | Lost 1st Rnd | G. Antetokounmpo (11.9) |
| 2016-17 | NBA | 42 | 40 | .512 | -0.45 | 94.5 | 109.1 | 0.3 | 109.3 | 0.5 | Lost 1st Rnd | G. Antetokounmpo (12.4) |
| 2015-16 | NBA | 33 | 49 | .402 | -3.98 | 94.2 | 104.3 | -2.1 | 108.7 | 2.3 | — | G. Monroe (7.5) |
| 2014-15 | NBA | 41 | 41 | .500 | -0.09 | 94.1 | 102.7 | -2.9 | 102.2 | -3.4 | Lost 1st Rnd | K. Middleton (6.7) |
| 2013-14 | NBA | 15 | 67 | .183 | -8.41 | 91.8 | 103.0 | -3.7 | 111.8 | 5.1 | — | J. Henson (3.3) |
| 2012-13 | NBA | 38 | 44 | .463 | -1.83 | 94.7 | 103.6 | -2.3 | 105.2 | -0.7 | Lost 1st Rnd | E. İlyasova (6.7) |
Data Visualization

Giannis Antetokounmpo
The Build to the Top
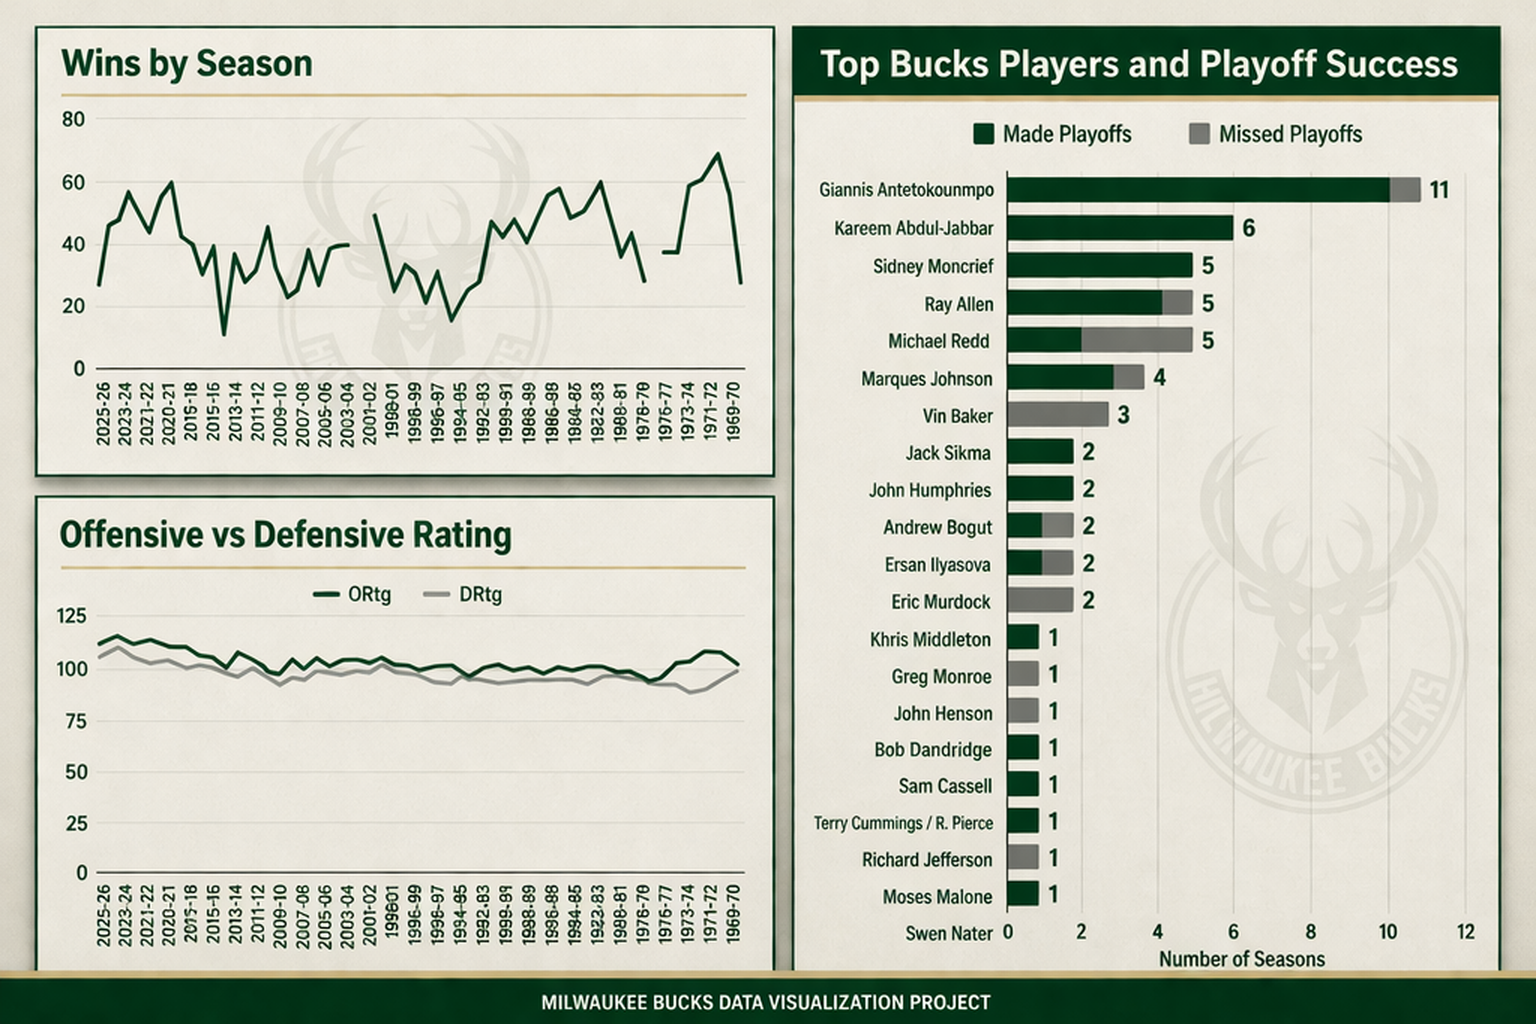
The Milwaukee Bucks' performance over time reveals a clear connection between team success, player leadership, and overall efficiency. The Wins by Season chart shows that the Bucks experienced strong periods of success during the early 1970s, mid-1980s, and most recently during the Giannis Antetokounmpo era. These peaks in wins suggest that when the team has strong leadership and roster stability, they are able to maintain sustained success across multiple seasons. In contrast, the dips in wins reflect rebuilding periods where the team struggled to find consistency.
The Offensive vs Defensive Rating chart further supports this pattern. During the most successful seasons, the Bucks maintained balanced offensive and defensive ratings. This suggests that success is not driven by offense alone, but rather by overall team efficiency. When either offensive or defensive ratings decline, team wins also tend to drop, showing the importance of maintaining balance on both ends of the court.
Finally, the Top Bucks Players and Playoff Success chart highlights the impact of individual leadership. Players such as Giannis Antetokounmpo, Kareem Abdul-Jabbar, and Sidney Moncrief appear most frequently during playoff seasons, indicating that dominant players often drive team success. Giannis stands out in particular, leading the team to the playoffs more consistently than other players, which aligns with the recent rise in wins shown in the first chart.
Together, these charts suggest that the Milwaukee Bucks’ success is driven by a combination of strong leadership, balanced team performance, and sustained roster stability. When these factors align, the team performs at its highest level and consistently reaches the playoffs.